|
Home
|
 'Risk On' Trade May Be Back Countertrend Rallies in Dollar, Euro, Stocks, Silver, Gold, and VIX May Be Over Soon
From Bloomberg:
On November 17th, we mentioned that 1,178 represented a possible level of support on the S&P 500. The market closed right on 1,178 on Wednesday, which means we open on Thursday from a logical rally point.
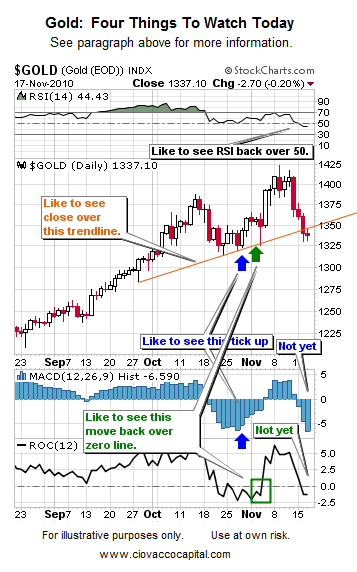
Before we show some evidence supporting a possible resumption of the acceptance of risk by market participants, let’s examine some simple ways to monitor the short-term battle between the bulls and the bears. If gold can close today in a bullish manner and take care of the four items outlined below, the odds of the recent bullish trends resuming in stocks, including emerging markets (EEM), and commodities (DBC) will have increased. From a bullish perspective, we would like to see the gold ETF (symbol GLD) finish up on strong volume; say, better than 32 million shares – the higher the volume the better. A low volume up day would be much less convincing.
Four bullish signals to watch for on the daily chart of gold: (1) RSI back above 50, (2) close above orange trendline, (3) MACD Histogram to “tick up”, (4) Rate of Change (ROC) to move back above zero. As of Wednesday’s close none of the four had occurred yet. If we get all four at the close on Thursday, it is bullish short-term for the price of gold, as well as for stocks and commodities in general.
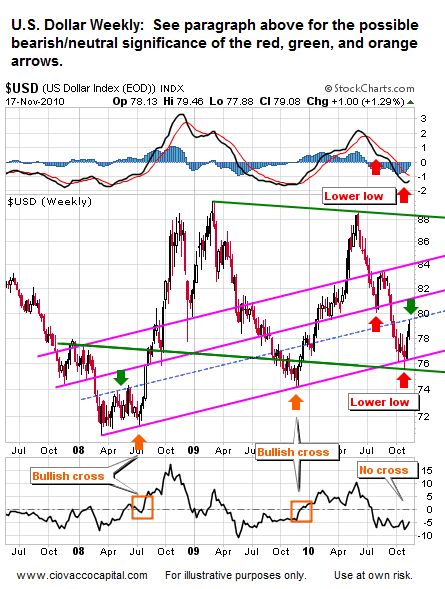
The rally in the U.S. dollar may be over, or at a minimum ready to take a break. As of Wednesday’s close, the weekly chart below shows no significant bullish divergences that would lead us to believe the recent rally in the dollar was anything other than a normal countertrend rally. Notice the thin blue dotted line below may provide resistance. Rate of Change (ROC) is shown at the bottom of the chart; it has not yet given a longer-term bullish signal for the dollar. We need to keep an eye on the dollar - trendlines show some possible uncertainty over the next few weeks.
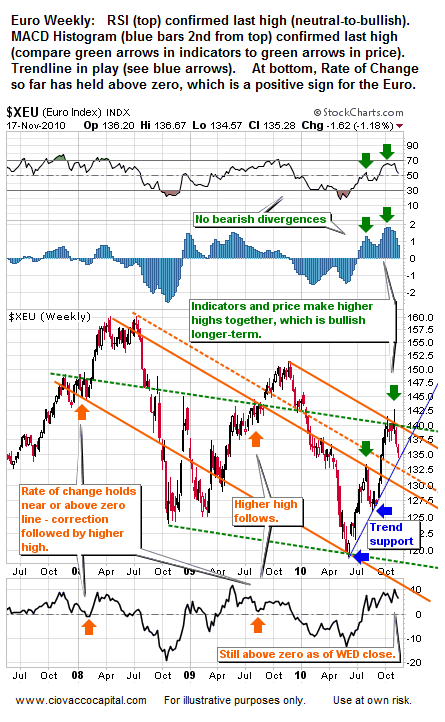
The weekly chart of the euro supports the possibility of the resumption of the rally and higher highs after the current correction has run its course. Notice the thin blue trendline may stem the recent decline in the euro. Like the dollar, the euro’s trendlines tell us to remain vigilant and open-minded over the next few weeks. If divergences appear on a weekly chart, it would be concerning.
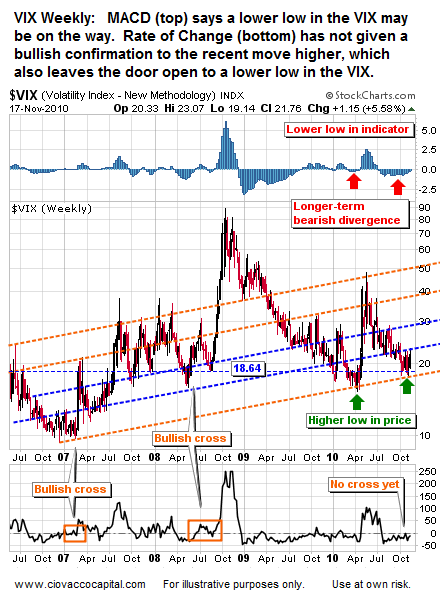
The weekly chart of the VIX does have a bearish MACD Histogram divergence with price, which supports the possibility of a lower low in the VIX. The Rate of Change indicator (bottom of chart) has not given a bullish signal, which also, as of Wednesday’s close, supports further VIX weakness.
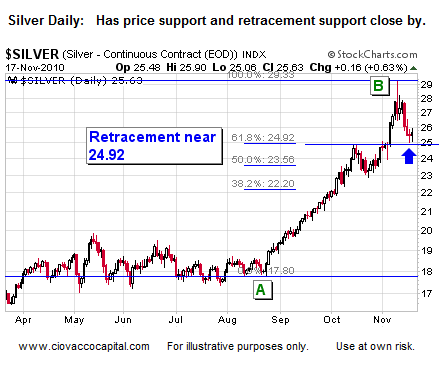
Traders often watch Fibonacci retracement levels; so it pays to keep these in your back pocket. The basic concept is all markets have natural ebb and flow where “giving back” some gains is a normal part of any healthy market. Retracements bring new buying interest and allow markets to move higher. Silver and gold both have retracements levels close by that may spark interest from traders. The retracement in silver is relative to the recent move from point A to point B (see below).
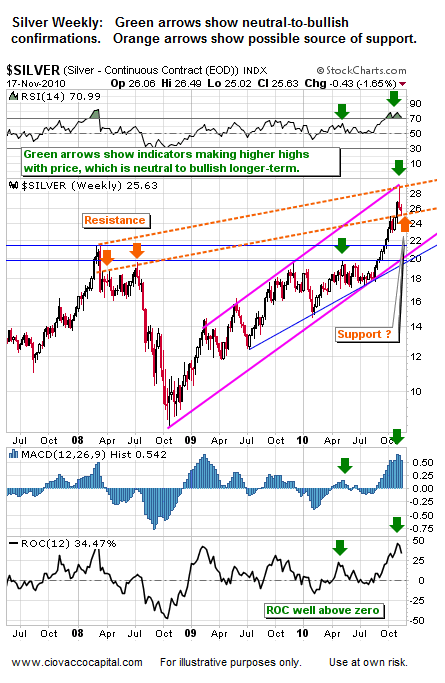
There are no bearish divergences on the weekly chart of silver, which supports the resumption of the uptrend after the current correction. Gold and silver, as well as most risk assets, are now at a point where their risk-reward ratios are much more favorable than they were a week ago.
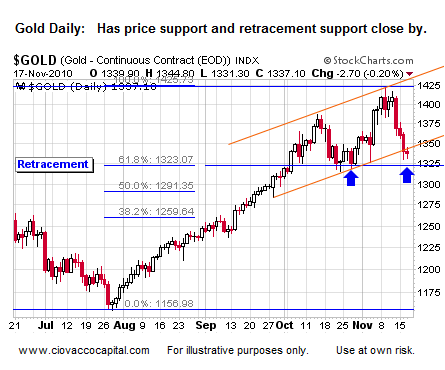
Like silver, gold has a retracement level and price support in the neighborhood. We need to watch the daily charts today for buy signals.
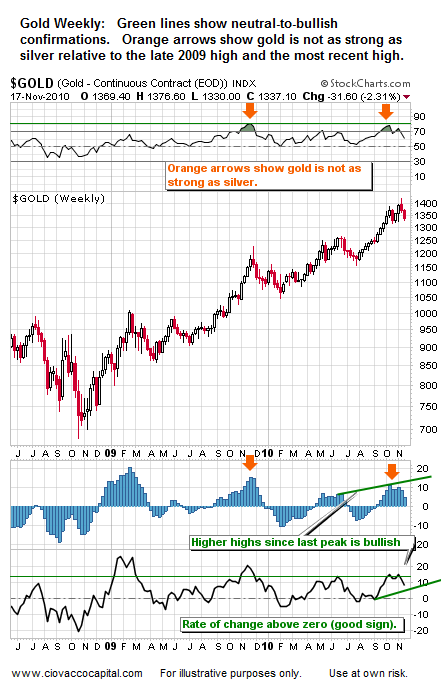
Gold’s weekly chart also supports a resumption of the uptrend, but relative to silver, gold is not as impressive.
Just as the elements were in place for countertrend rallies in stocks, dollar, euro, gold, silver, and the VIX on November 10th, the elements are now in place for a possible resumption of the primary trends. Volume and breadth can help us read the conviction of any market moves on Thursday. Any gains need to be held into today’s close. Markets will open higher; so the majority of today’s gains cannot be captured. However, further gains seem probable if we see what we want to see over the next few days. As always, keeping an open mind and paying attention to what is happening, rather than what we think will happen, is extremely important. We need to see short-term buy signals, which were not present as of Wednesday’s close. If we have time, we may post some updates during the day on Short Takes.
Videos on Investing and Quantitative Easing.
Chris Ciovacco
Terms of Use. The charts and comments are only the author's view of market activity and aren't recommendations to buy or sell any security. Market sectors and related ETFs are selected based on his opinion as to their importance in providing the viewer a comprehensive summary of market conditions for the featured period. Chart annotations aren't predictive of any future market action rather they only demonstrate the author's opinion as to a range of possibilities going forward. All material presented herein is believed to be reliable but we cannot attest to its accuracy. The information contained herein (including historical prices or values) has been obtained from sources that Ciovacco Capital Management (CCM) considers to be reliable; however, CCM makes no representation as to, or accepts any responsibility or liability for, the accuracy or completeness of the information contained herein or any decision made or action taken by you or any third party in reliance upon the data. Some results are derived using historical estimations from available data. Investment recommendations may change and readers are urged to check with tax advisors before making any investment decisions. Opinions expressed in these reports may change without prior notice. This memorandum is based on information available to the public. No representation is made that it is accurate or complete. This memorandum is not an offer to buy or sell or a solicitation of an offer to buy or sell the securities mentioned. The investments discussed or recommended in this report may be unsuitable for investors depending on their specific investment objectives and financial position. Past performance is not necessarily a guide to future performance. The price or value of the investments to which this report relates, either directly or indirectly, may fall or rise against the interest of investors. All prices and yields contained in this report are subject to change without notice. This information is based on hypothetical assumptions and is intended for illustrative purposes only. PAST PERFORMANCE DOES NOT GUARANTEE FUTURE RESULTS.
|