|
Home
|
 Short-Term Concerns Remain for Gold Could Impact Yellow Metal Over Next Few Months
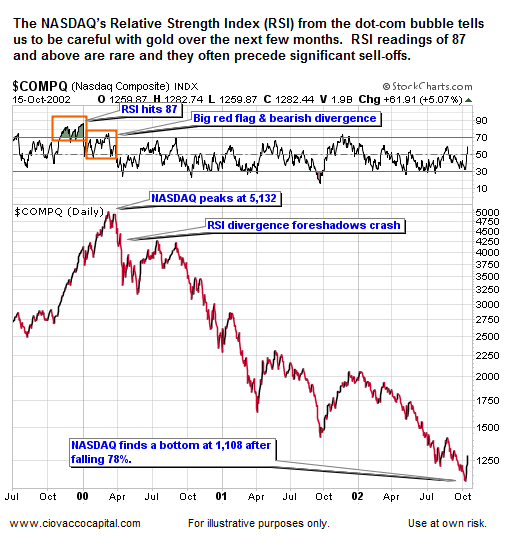
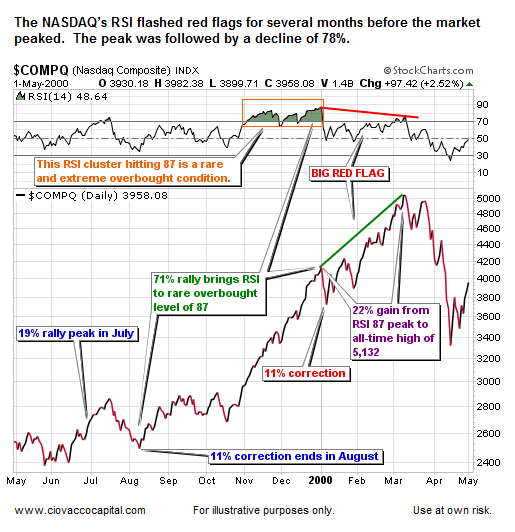
It is very rare for the relative strength index (RSI) of any market to rise to a level of 87 or above. When RSI on a daily chart hits 87 and then begins to back off that level, the market may be in the final stages of its current advance. In the chart of the NASDAQ below, notice how price continued to advance, but RSI made a much lower high, which is known as a bearish divergence.
In 2000, while the RSI divergence was present, in order to capture the last 22% of near-vertical rise of the NASDAQ, you had to expose your capital to the potential of a significant decline – a decline that turned out to be 78% during the 2000-2002 bear market. When significant RSI divergences are present, the market’s risk-reward profile is most likely becoming unattractive.
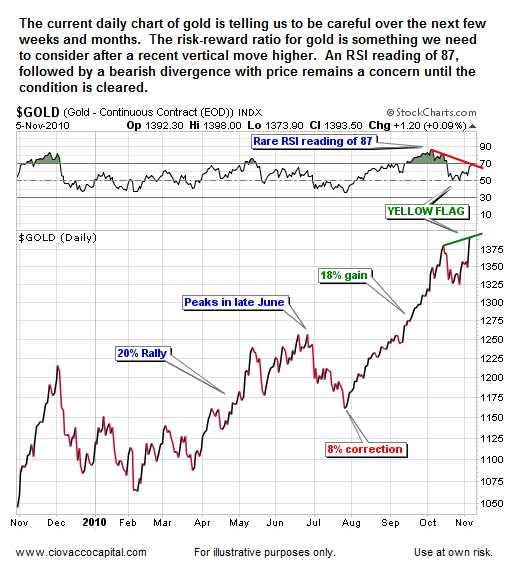
The chart below shows the current advance in gold. Like the NASDAQ in 2000, gold’s RSI was recently overbought and hit a high reading near 87. Thus far, like the NASDAQ in 2000, the most recent move higher in gold is coming with a significant bearish divergence in RSI (RSI is not making a higher high along with price). Like the NASDAQ in 2000, unless RSI and price can clear the current divergence, gold's risk-reward ratio is less appealing than many may understand.
The chart below is a more detailed look at the NASDAQ’s peak in 2000. Compare the chart of the NASDAQ below to the chart of gold above; pay special attention to the similarities between RSI. The NASDAQ advanced for three more months with the RSI divergence in place (see above), so gold in 2010 may run quite a bit higher, but not without added downside risks. The term risk-reward acknowledges gold could move higher in the coming weeks and months. Our concern relates to the ratio of the probable upside vs. the probable downside in the short-to-intermediate term. As money managers, we have to be careful about our percentage allocation to an asset class with significant RSI divergences.
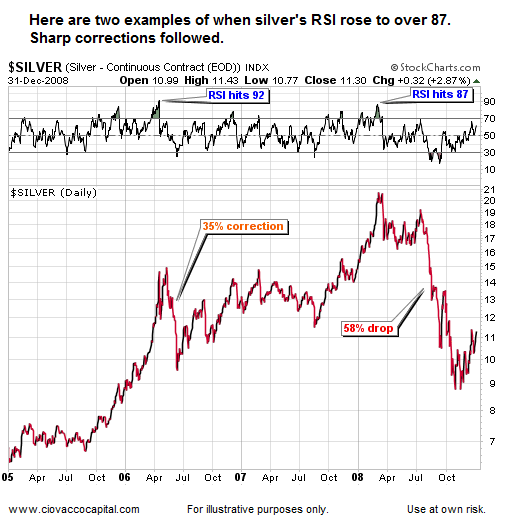
You have to look for quite some time to find markets that have experienced an RSI reading of 87 or above on a daily chart; below are two historical examples. The risk-reward ratio for silver in 2006 and again in 2008 was unfavorable as RSI backed off after reaching 87 or higher. Declines of 35% and 58% followed RSI readings of 92 and 87 respectively.
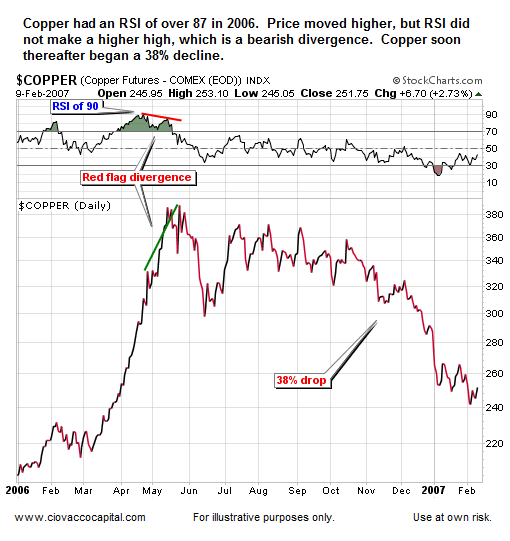
Copper advanced in 2006 as RSI backed off a level of 90 (see below). Those who ignored the bearish divergences were eventually hit with a correction of 38%. Copper’s final push higher in 2006 shows markets can continue to advance even in the face of RSI divergences, but more often than not the divergences come into play in a substantially negative fashion.
Owning gold still makes sense, but until the current divergences are cleared or a correction unfolds, our allocations will reflect the current deterioration in gold’s short-to-intermediate-term risk-reward profile.
We also will continue to monitor some short-term concerns which still linger related to a possible counter-trend rally in the U.S. dollar. A dollar rally would be a negative driver for gold, silver, and copper.
Quantative Easing & Investing: CCM Video Series
Chris Ciovacco
Terms of Use. The charts and comments are only the author's view of market activity and aren't recommendations to buy or sell any security. Market sectors and related ETFs are selected based on his opinion as to their importance in providing the viewer a comprehensive summary of market conditions for the featured period. Chart annotations aren't predictive of any future market action rather they only demonstrate the author's opinion as to a range of possibilities going forward. All material presented herein is believed to be reliable but we cannot attest to its accuracy. The information contained herein (including historical prices or values) has been obtained from sources that Ciovacco Capital Management (CCM) considers to be reliable; however, CCM makes no representation as to, or accepts any responsibility or liability for, the accuracy or completeness of the information contained herein or any decision made or action taken by you or any third party in reliance upon the data. Some results are derived using historical estimations from available data. Investment recommendations may change and readers are urged to check with tax advisors before making any investment decisions. Opinions expressed in these reports may change without prior notice. This memorandum is based on information available to the public. No representation is made that it is accurate or complete. This memorandum is not an offer to buy or sell or a solicitation of an offer to buy or sell the securities mentioned. The investments discussed or recommended in this report may be unsuitable for investors depending on their specific investment objectives and financial position. Past performance is not necessarily a guide to future performance. The price or value of the investments to which this report relates, either directly or indirectly, may fall or rise against the interest of investors. All prices and yields contained in this report are subject to change without notice. This information is based on hypothetical assumptions and is intended for illustrative purposes only. PAST PERFORMANCE DOES NOT GUARANTEE FUTURE RESULTS.
|