|
Home
|
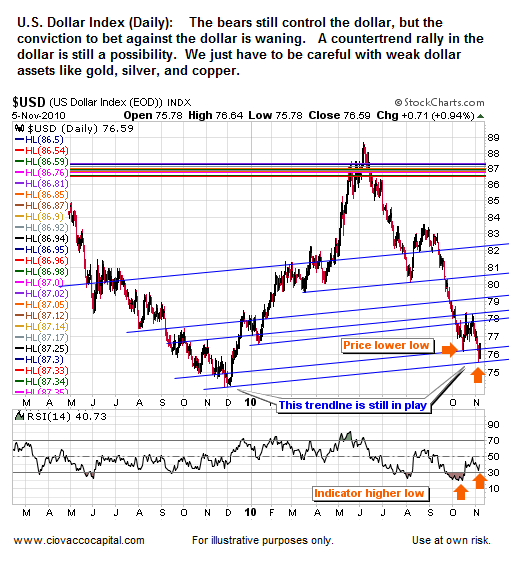
 Dollar Rally Still Quite Possible Bears' Grip Is Weakening
As shown below, a short-term bullish divergence remains in place between price and the dollar’s relative strength index. The condition can be cleared if RSI drops over the next few trading sessions. A trendline from December of 2009 is also in a position to lend possible support to the dollar (see blue line).
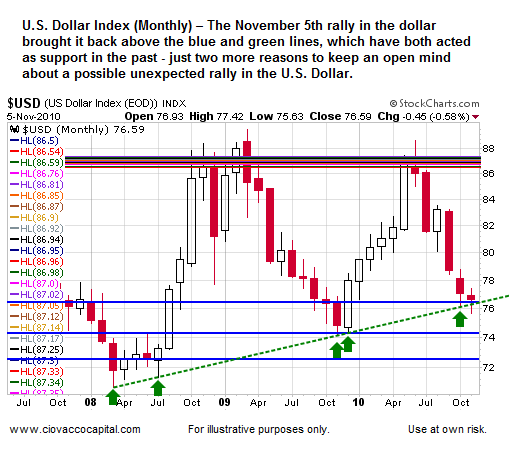
If we move to a broader timeframe using a monthly chart, we see the trendline extends all the way back to 2008 (see green dotted line). A trendline on a monthly chart is more significant than one on a short-term daily chart.
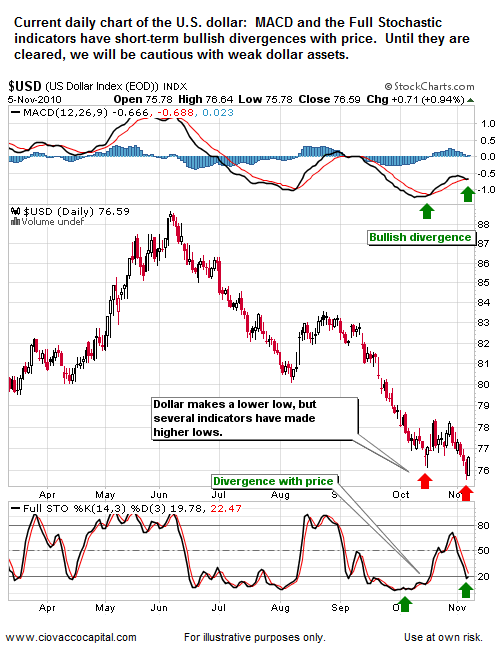
The dollar’s daily chart is also showing some potentially bullish divergences. While the U.S. Dollar Index recently made a lower low, several technical indicators have not followed.
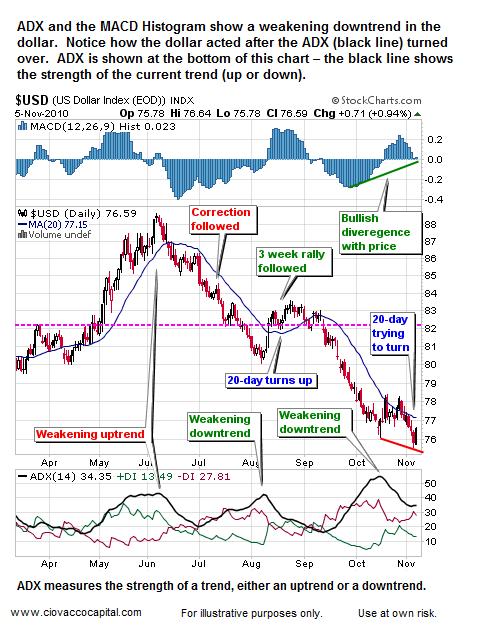
The chart below contains several indicators that continue to support a possible short-term rally in the dollar. ADX (shown at the bottom of the chart) is of particular concern. According to Dr. Alexander Elder in Trading For A Living:
Notice how well Dr. Elder’s comments relate to the recent action in the U.S. dollar. The black ADX line recently turned down from above both the red and green directional lines, which is a textbook red flag relative to a possible change in trend from down to up.
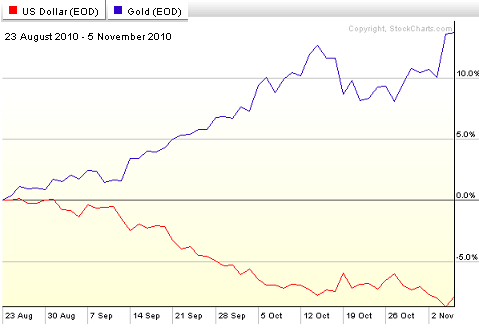
Many believe, including us at CCM, the current rally off the summer lows was sparked mainly by the expectation the Fed would print more money. The chart below shows as the U.S. dollar (red line) began to weaken again in August of 2010, weak dollar assets, like gold (blue line), began to rally. If the dollar rallies, then weak-dollar assets may consolidate for a time or experience pullbacks. Our concern is correlation risk between the dollar, gold, silver, oil, and copper.
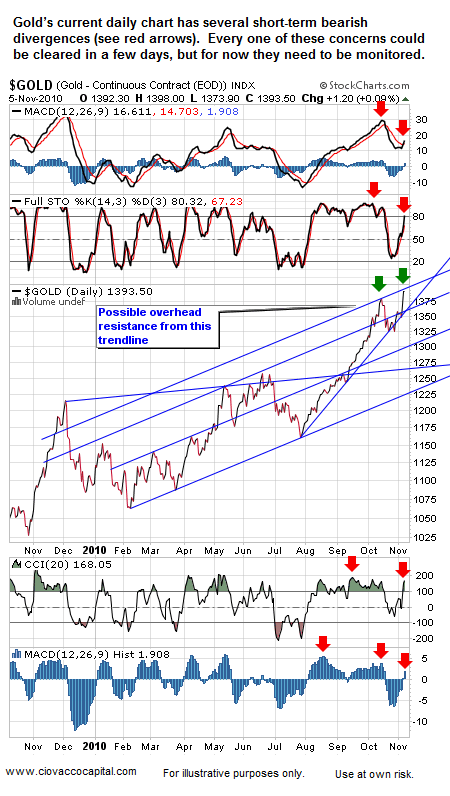
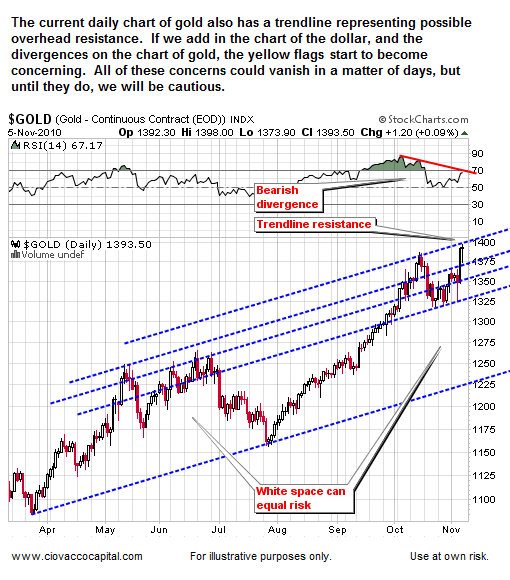
Below is a similar look highlighting the trendlines in gold and the short-term divergence in RSI which has not yet been cleared.
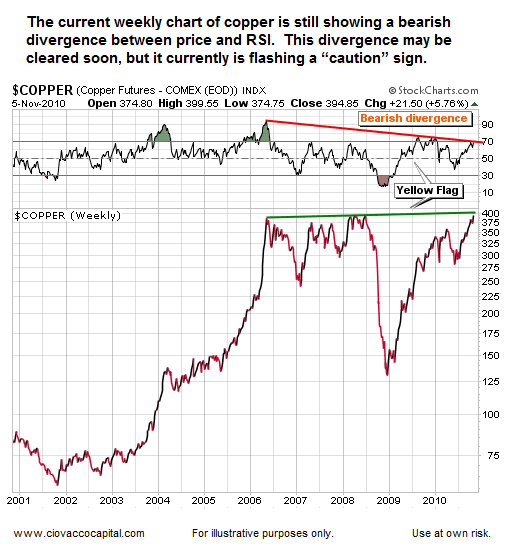
Our concerns extend to other inflation-protection assets, like copper. These divergences do not mean copper and gold cannot advance, but they do mean the downside risks have increased relative to the upside potential, as least for the short-term.
Could the dollar continue to fall? Yes. Could gold, silver, copper, and oil continue to rise? Yes, but we have to decide how much risk we are willing to take in order to seek additional gains. While we still hold gold, silver, and copper, our decision to reduce our exposure to these assets was based on deteriorating short-term, risk-reward profiles. When the conditions outlined above are no longer present and the risk-reward profiles improve, we will revisit our exposure to inflation-friendly assets. Additional short-to-intermediate-term concerns related to gold are covered in Short-Term Concerns Remain for Gold.
Quantative Easing & Investing: CCM Video Series
Chris Ciovacco
Terms of Use. The charts and comments are only the author's view of market activity and aren't recommendations to buy or sell any security. Market sectors and related ETFs are selected based on his opinion as to their importance in providing the viewer a comprehensive summary of market conditions for the featured period. Chart annotations aren't predictive of any future market action rather they only demonstrate the author's opinion as to a range of possibilities going forward. All material presented herein is believed to be reliable but we cannot attest to its accuracy. The information contained herein (including historical prices or values) has been obtained from sources that Ciovacco Capital Management (CCM) considers to be reliable; however, CCM makes no representation as to, or accepts any responsibility or liability for, the accuracy or completeness of the information contained herein or any decision made or action taken by you or any third party in reliance upon the data. Some results are derived using historical estimations from available data. Investment recommendations may change and readers are urged to check with tax advisors before making any investment decisions. Opinions expressed in these reports may change without prior notice. This memorandum is based on information available to the public. No representation is made that it is accurate or complete. This memorandum is not an offer to buy or sell or a solicitation of an offer to buy or sell the securities mentioned. The investments discussed or recommended in this report may be unsuitable for investors depending on their specific investment objectives and financial position. Past performance is not necessarily a guide to future performance. The price or value of the investments to which this report relates, either directly or indirectly, may fall or rise against the interest of investors. All prices and yields contained in this report are subject to change without notice. This information is based on hypothetical assumptions and is intended for illustrative purposes only. PAST PERFORMANCE DOES NOT GUARANTEE FUTURE RESULTS.
|