|
Home
|
 Strategy and Outlook for a ‘Prove it to me’ Market S&P 500 Support Study & Asset Class Analysis March 16, 2011
From a fundamental perspective, the news from Japan and ongoing reaction to the Fed will most likely carry over into Wednesday’s trading session. The Fed’s statement neither hinted at QE3, nor did they close the door relative to expanding QE2. The text related to their current bond purchase program: The part that reads "...and will adjust the program as needed..." could be interpreted as either a contraction or expansion of the current $600 billion target. The S&P 500 was trading at 1,277 when the Fed’s statement was released. Given the close of 1,282, it is difficult to interpret the market’s short-term reaction as bullish; neutral would probably be a better short-term classification. In terms of our approach to the markets, we need to get a better read on the reaction to the Fed’s statement, which should come by mid-day on Wednesday.
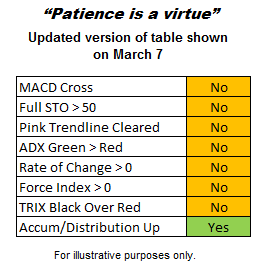
According to reports a new fire has been reported in the No. 4 reactor in the damaged nuclear complex in Japan. In the last 24 hours, aftershocks of 5.7 and 6.1 magnitudes have kept citizens and officials on edge. Add in people without homes, homes without power, and freezing temperatures and you have conditions in Japan that may continue to negatively impact asset prices. However, the Asian markets were able to post gains in mid-morning trading on Wednesday. Obviously, changes for the better or additional negative developments in Japan need to be monitored since they will impact the short-to-intermediate-term tone of the markets. As long as nuclear uncertainty exists in its present form, we will err on the side of holding cash and buying in limited quantities should the market show some improvement. To help us monitor the market’s take on the Fed and Japan, while addressing the question of how long should we stay defensive, we will use the technical checklist below as a forced disciplined tool. We first presented the table below using data from March 7, 2011, which helped us remain patient with our cash over the last ten days.
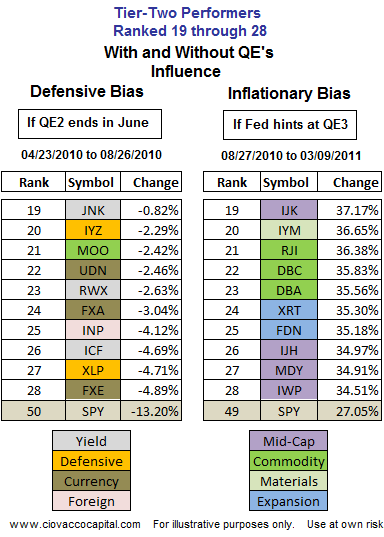
The basic concepts in the table above can be summed up as follows: Assuming the conditions above are met and we are more comfortable with Japan and the reaction to the Fed, the next question on the docket is where to redeploy our cash. As we mentioned yesterday, we still believe the market’s perception of where the Fed is headed with quantitative easing is important relative to what to buy. When the majority or all of the conditions in the technical table above are satisfied, we will consider the inflation-friendly assets on the right side of the table below and on the right side of yesterday’s table. Should the current correction morph into something looking more like a topping process, we will consider the defensive assets on the left side of the table below and on the left side of yesterday's table.
Fundamentally, the results in the table above make intuitive sense with more conservative and stable earners, such as telecom (IYZ) and consumer staples (XLP), appearing on the left and more cyclical earners, such as retail (XRT), technology (FDN), mid-caps (MDY), and materials (IYM, XLB), appearing on the right. Since the S&P 500 has corrected over 6% from the recent highs to the recent lows, we are more open to redeploying some cash if we get some evidence of a possible turn in stocks. We need more information from Japan and the markets before we can choose to focus on defensive or inflationary assets. For now we will hold our longs and a relatively large cash position that we have accumulated over the last few weeks. Based on the incremental approach, we did some limited selling yesterday, cutting back on gold stocks (GDX), Australia (EWA), Germany (EWG), and inverse Treasury bonds (TBT). Numerous economic reports, which may impact our thinking, are due to be released this week, including inflation (CPI), weekly jobless claims, industrial production, leading indicators, the Philly Fed survey, and an update on the Fed’s balance sheet.
We have addressed the first two questions posed at the top of the article. We will now turn our attention to trying to better understand:
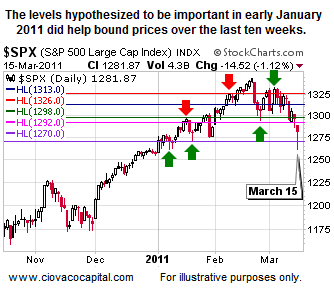
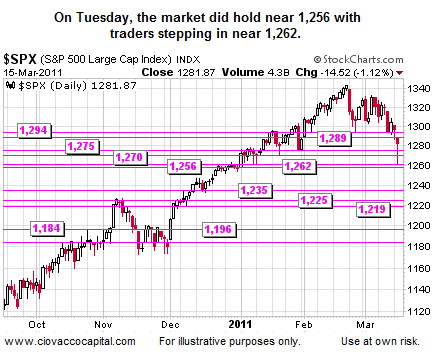
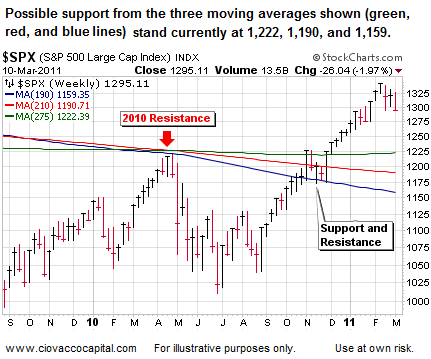
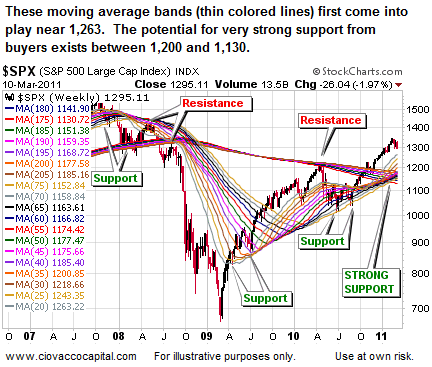
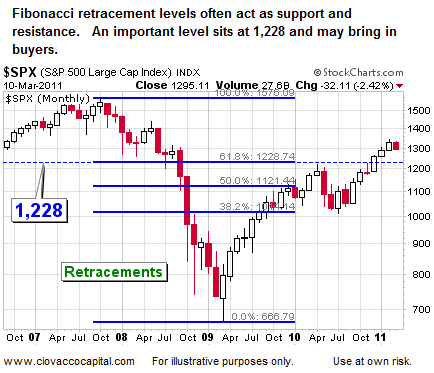
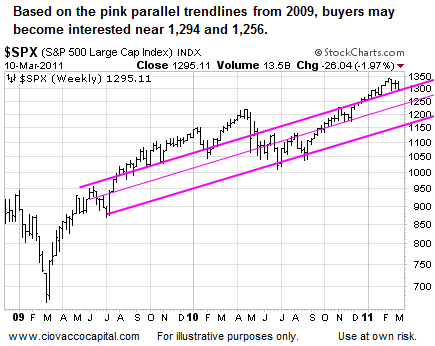
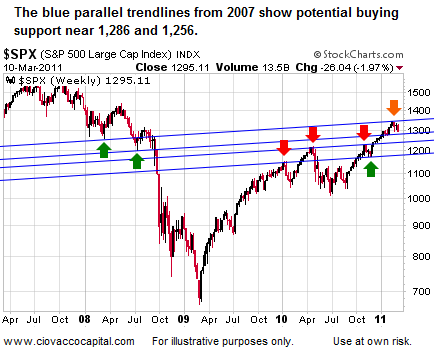
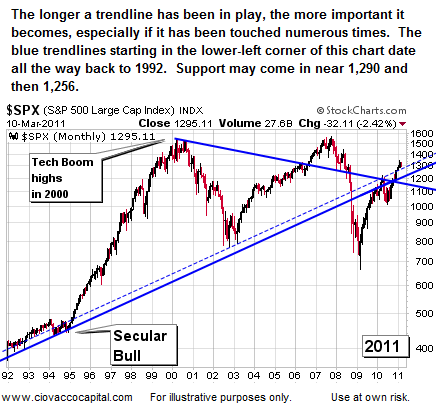
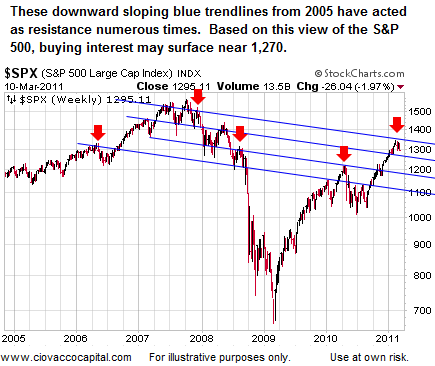
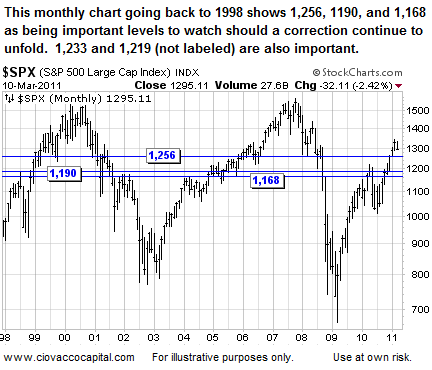
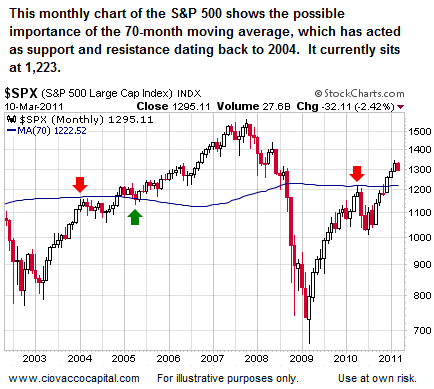
Before we move to the table below, it may be helpful from a confidence and usefulness perspective to check back on a recent support and resistance study. On January 7, 2011, we presented a summary table that highlighted 1,316 and 1,326 as probable areas where stocks could run into some trouble. We also listed 1,292 and 1,298 as possible areas where sellers may become more active. The market was only able to stay above 1,326 for four trading days before sellers took over. The term 'probable' is used above as a way to acknowledge in advance that both support and resistance can be broken and/or we could be wrong about certain levels remaining important in future sessions.
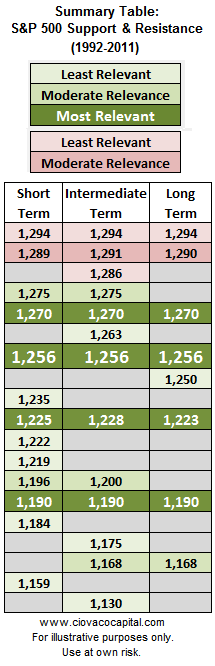
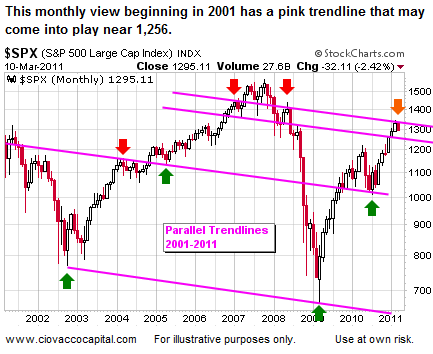
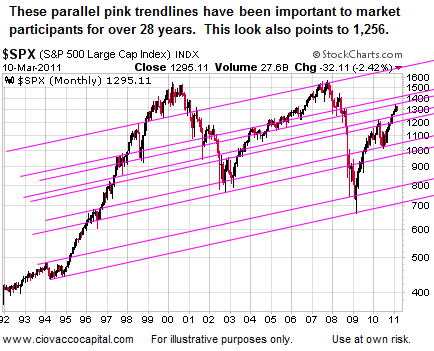
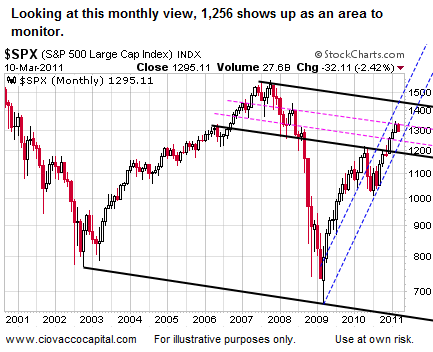
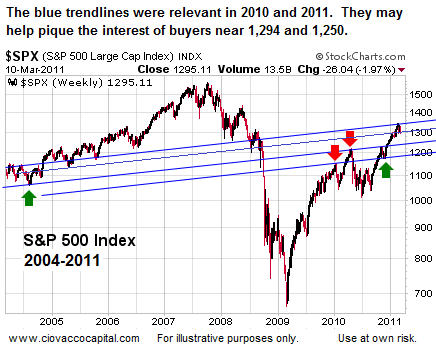
For those not familiar with technical analysis, there is no need to review the charts below; they are presented for readers who want more confidence in the levels shown in the summary table above. The concepts in the charts below are summarized in the table above.
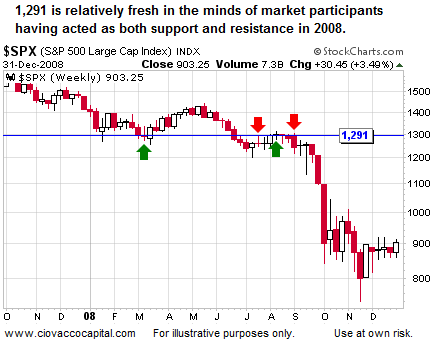
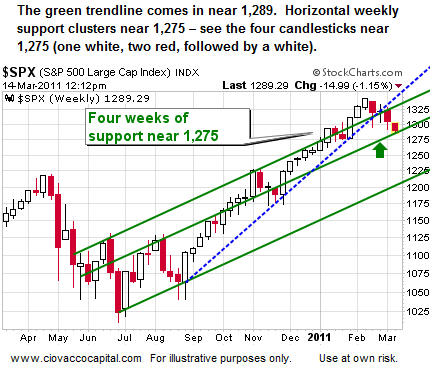
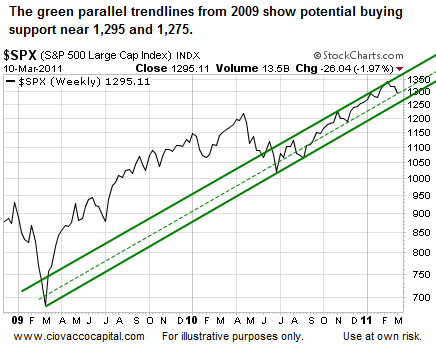
The charts below are taken from a recent study we conducted focusing on short, intermediate, and long-term support for stocks. The concept of support and resistance speaks to the memory of market participants, and maybe more importantly the computer-driven trading algorithms used by numerous hedge funds, pensions, and mutual funds. Market levels that have been important in the past tend to be important again when revisited in subsequent trading sessions.
Quantative Easing & Investing: CCM Video Series
Chris Ciovacco
Terms of Use. The charts and comments are only the author's view of market activity and aren't recommendations to buy or sell any security. Market sectors and related ETFs are selected based on his opinion as to their importance in providing the viewer a comprehensive summary of market conditions for the featured period. Chart annotations aren't predictive of any future market action rather they only demonstrate the author's opinion as to a range of possibilities going forward. All material presented herein is believed to be reliable but we cannot attest to its accuracy. The information contained herein (including historical prices or values) has been obtained from sources that Ciovacco Capital Management (CCM) considers to be reliable; however, CCM makes no representation as to, or accepts any responsibility or liability for, the accuracy or completeness of the information contained herein or any decision made or action taken by you or any third party in reliance upon the data. Some results are derived using historical estimations from available data. Investment recommendations may change and readers are urged to check with tax advisors before making any investment decisions. Opinions expressed in these reports may change without prior notice. This memorandum is based on information available to the public. No representation is made that it is accurate or complete. This memorandum is not an offer to buy or sell or a solicitation of an offer to buy or sell the securities mentioned. The investments discussed or recommended in this report may be unsuitable for investors depending on their specific investment objectives and financial position. Past performance is not necessarily a guide to future performance. The price or value of the investments to which this report relates, either directly or indirectly, may fall or rise against the interest of investors. All prices and yields contained in this report are subject to change without notice. This information is based on hypothetical assumptions and is intended for illustrative purposes only. PAST PERFORMANCE DOES NOT GUARANTEE FUTURE RESULTS.
|