|
Home
|
 Using Monthly and Weekly Charts to Monitor the Health of Bull and Bear markets. ATLANTA
Monthly Charts: Significant Trend Changes May Be OccurringNumerous monthly charts are telling us to remain patient during any further corrective action. As you look at these charts, ask yourself:
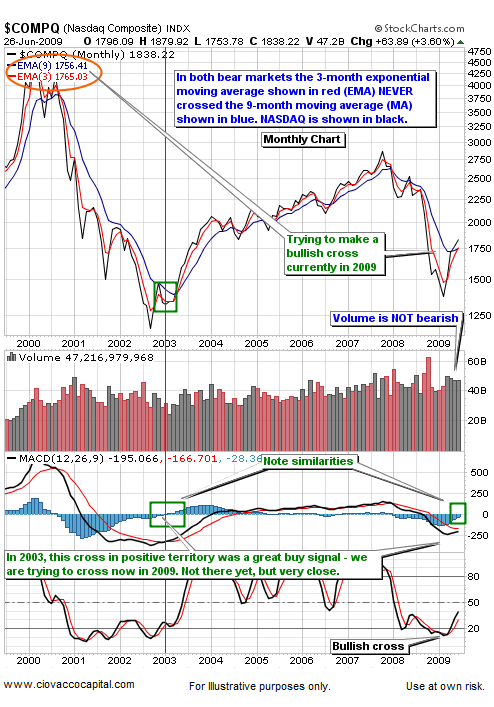
Positive signals from monthly charts, due to their longer-term nature, are more significant than signals from daily or weekly charts. We may be in the process of getting a rare and significant bullish signal from the NASDAQ's monthly chart. In the chart below, we compare the two bear markets (2000-2003 and 2007-2009) to the current situation. A MACD histogram crossover from negative territory to positive territory would add to the weight of the long-term bullish evidence (see light blue bars).
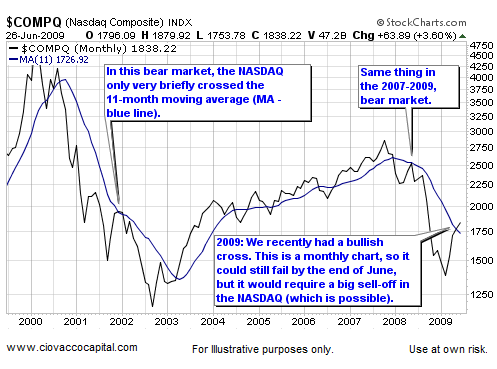
 The chart below of the NASDAQ uses a different simple monthly moving average (11 week - see blue line) to support the basis for a possible long-term change in trend for the NASDAQ.
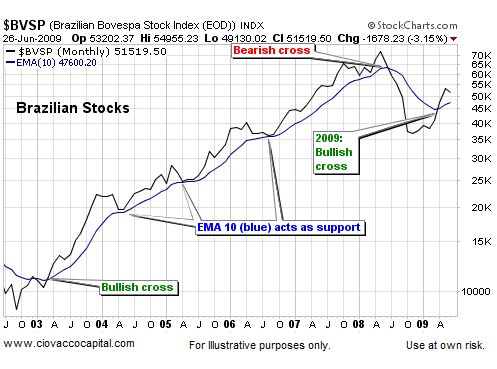
 Stocks in Brazil have been leaders in the current rally off the lows. The recent break above the 10-month simple moving average (MA) bodes well for the long-term outlook of this index.
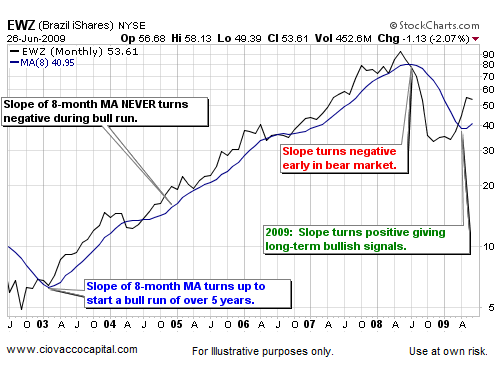
 Using the Brazil ETF (EWZ) below, we see it is rare for the slope of the 8-month MA to change direction. It has occurred only three times since late 2002, the first two occurances signaled a change in the long-term trend. The third (turning up) occurred recently.
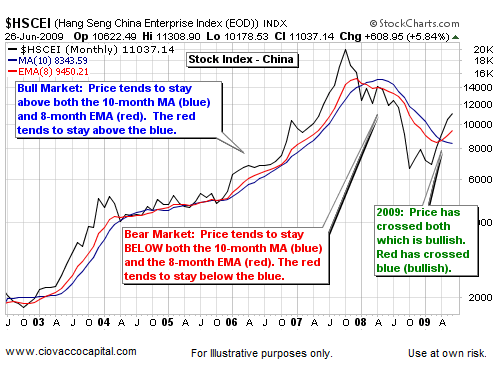
 The monthly chart of Chinese stocks recently experienced two bullish events.
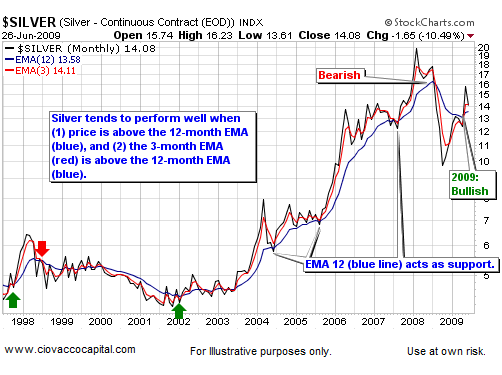
 Silver has significantly outperformed gold in 2009, which is potentially bullish. Silver tends to lead gold during the early stages of an economic recovery since it has more industrial uses. Silver's 12-month MA (see blue line below) may now act as support.
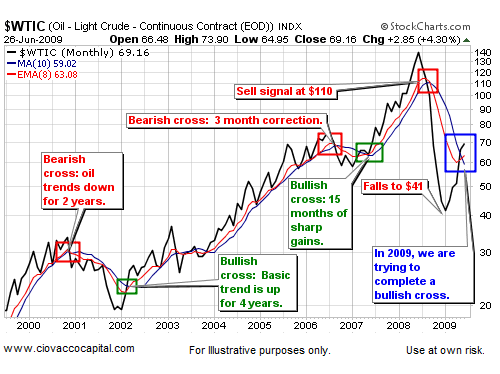
 We recently saw the 8-month exponential moving average (EMA) cross the 10-month MA in crude oil. Going back to 2000, this moving average crossover has been worth watching.
Weekly Charts: More Corrective Action May Be NeededThe chart of FXI (China Index) below paints a good-news-bad-news scenario we currently have in many markets. The good news is positive trends remain intact. The bad news is the recent loss of momentum may be foreshadowing more corrective action. Last week may have been the first leg down in a normal correction. It is not unusual for corrections to have two or three legs down before the primary trend resumes. The corrective process can also take the form of a trading range or sideways action, which we would prefer to further corrections. These comments are based on the information we currently have in hand, which is subject to change. The MACD Histogram, especially on a weekly chart, can help us monitor the conviction of the bulls.

Chris Ciovacco
Chris Ciovacco is the Chief Investment Officer for Ciovacco Capital Management, LLC. More on the web at www.ciovaccocapital.com All material presented herein is believed to be reliable but we cannot attest to its accuracy. The information contained herein (including historical prices or values) has been obtained from sources that Ciovacco Capital Management (CCM) considers to be reliable; however, CCM makes any representation as to, or accepts any responsibility or liability for, the accuracy or completeness of the information contained herein or any decision made or action taken by you or any third party in reliance upon the data. Some results are derived using historical estimations from available data. Investment recommendations may change and readers are urged to check with tax advisors before making any investment decisions. Opinions expressed in these reports may change without prior notice. This memorandum is based on information available to the public. No representation is made that it is accurate or complete. This memorandum is not an offer to buy or sell or a solicitation of an offer to buy or sell the securities mentioned. The investments discussed or recommended in this report may be unsuitable for investors depending on their specific investment objectives and financial position. Past performance is not necessarily a guide to future performance. The price or value of the investments to which this report relates, either directly or indirectly, may fall or rise against the interest of investors. All prices and yields contained in this report are subject to change without notice. This information is based on hypothetical assumptions and is intended for illustrative purposes only. PAST PERFORMANCE DOES NOT GUARANTEE FUTURE RESULTS.
|
