 HOME - More Research
PDF Version - Printer Friendly Client Update - October 1, 2007 EXECUTIVE SUMMARY The continued deterioration in the housing market has brought into question the value of countless complex financial derivatives, including many pooled investments tied to the value of mortgages. The complexity and sheer number of parties involved with these investments has created questions about the future risk of default at any point in the daisy chain of counter parties. This uncertainty has greatly increased the desire of many banks and large institutions to hold their cash reserves. This has reduced the availability of credit at the worst possible time for both the housing market and overall economy. In an effort to stem the negative tide, the Federal Reserve has ushered in a new investment cycle with September's interest rate cut. The new cycle will bring with it increased concerns about inflation. Lower rates encourage more borrowing, which increases the supply of money within the framework of the fractional banking system. More money in the economy helps inflate the price of goods, services, and assets. An increase in the money supply also helps drive down the purchasing power of the U.S. dollar relative to other currencies. Therefore, it is important we continue to strike a balance, based on each client's needs, between principal preservation and purchasing power preservation. My detailed historical research, coupled with the current state of the markets, supports the direction in which we are headed with our current approach. The reduction in interest rates and increasing fears of inflation diminish the attractiveness of fixed income investments, such as bonds and CDs. Similarly, after a rate cut, investors have historically favored assets, such as stocks and commodities, which can better protect their hard earned purchasing power. An environment where the U.S. dollar is also under pressure creates investment demand for foreign assets and tangibles assets, such as gold, silver, timber, and commodities. As a result, it is prudent to consider making some minor changes to our asset allocations based on the information above and the table below. 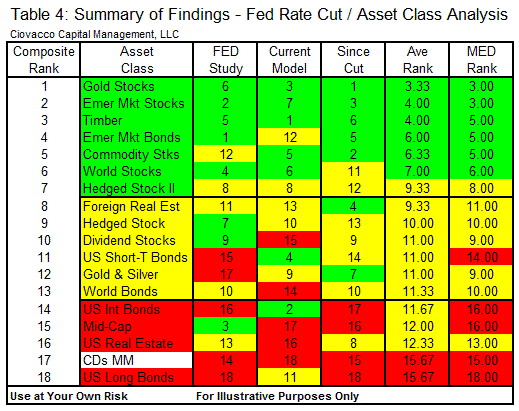
Asset Class Behavior Following Fed Rate CutsBy Chris CiovaccoSeptember 28, 2007
Associated Press -09/28/2007
Purchasing Power is of Primary ImportanceSince our money is only as valuable as what it can buy for us, a well thought out investment strategy should always strike a balance between preservation of capital and preservation of purchasing power. On the one hand, an approach which is too conservative can leave an investor wondering how their standard of living seems to be going backward even though their CDs are earning interest. On the other hand, an overly aggressive approach can lead to sleepless nights and large losses, from which it is difficult to recover. We will attempt to show why in the age of credit expansion it may be more important than ever to approach investing from both ends of the risk spectrum. As a money manager and financial advisor, my task is similar to a cardiologist who instructs his patients to remain active after a heart attack while at the same time avoiding too much stress on their recently damaged hearts. If the patient becomes too sedentary, it can be costly. If the patient adopts an overly ambitious exercise regimen it can also be harmful. Balance is the key.
Perception Is RealityWith the Federal Reserve (Fed) somewhat surprising Wall Street with a .50% reduction in interest rates, we have officially moved from a cycle of increasing rates (June 2004 - June 2006), to a cycle of flat rates (July 2006 - August 2007), to a cycle of declining rates (September 2007 - ?). While the actual impact the Fed has on market interest rates has diminished over time, Wall Street's perception is the Fed still matters a great deal. What matters to us is the new Fed cycle will influence investors' actions, and thus influence the relative returns of different asset classes such stocks, bonds, commodities, timber and commercial real estate.
Why Did The Fed Lower Rates?Wall Street has been packaging more and more complex investments over the years, such as bundling traditional mortgages with sub-prime mortgages and selling a stake in the form of a bond. Investors, including large institutions and hedge funds, have purchased portions of these mortgage pools after being told the diversified mix of mortgages minimizes their risk. Everything looks fine until someone stops paying somewhere along the food chain, and matters become even worse when several parties simultaneously stop paying. The ever increasing complexity of these derivative investment vehicles has caused participants to question how much risk they are really exposed to. The complexity also creates uncertainty as to the future need for capital in the event more defaults occur. Another problem tied to the complex and uncertain nature of these investments is a growing mistrust between counterparties. Since many banks, institutions, and hedge funds do not know what the future may hold, the tendency is to hold onto your cash until the smoke clears. According to the Economist, "it could take months to put prices on these complicated mix of investments". As a result, the availability of credit has diminished in recent weeks. Obviously, tighter credit conditions are the last thing a housing market on the ropes needs. The Fed knows a significant portion of our economic growth since 2000 has been fueled by low interest rates, easy access to credit, and rising home values. They lowered interest rates in an effort to slow the negative momentum.The Weakening Dollar: Fed's Actions Have ConsequencesLower interest rates lead to lower borrowing costs, which increases the demand for loans and access to credit. In the fractional banking system, new loans create new money which increases (or inflates) the money supply and reduces the purchasing power of the dollars we currently hold. More money chasing a relatively stable amount of goods and services can lead to "bad" price inflation. Monetary inflation can also lead to rising prices in stocks or real estate or "good" inflation. Newly created money also devalues the money in your pocket via simple supply and demand. Therefore, the terms inflation, a declining U.S. dollar, currency debasement, etc. all refer to an expanding money supply. A hedge against inflation is also a hedge against the declining value of any paper or fiat currency. Credit creation and money supply expansion are not limited to the United States; we just may be the leader in terms of being addicted to credit. I have written on theses topics in the past with the most relevant articles being:The U.S. Dollar vs. Gold: You Should Care Investing In Today's Inflationary World What Can We Learn From 1923 Germany? How to Protect Yourself from Investment Losses and Inflation A Better Read on the Bernanke FedWall Street coined the term "Greenspan put" to describe the former Fed chairman's willingness to quickly lower interest rates during periods of "instability", which is a politically correct way of describing a period when risk takers are suffering large losses. A put contract is like an insurance policy which covers or offsets investment losses. Therefore, the Greenspan put referred to the confidence risk takers had in Mr. Greenspan's willingness to protect them with rate cuts in declining asset markets. It is similar to a teenager who may feel they can take more behavioral risks knowing their parents would ride to the rescue in their time of need. As you might imagine, the Greenspan put helped increase the risk tolerance of many investors, which in turn helped fuel bubbles in tech stocks and housing. The Greenspan put was a two-pronged bubble blower. Individuals and institutions could invest money borrowed at lower rates. As an added bonus, investors also got an insurance policy against being hurt too badly in declining asset markets.With a new sheriff in town, Chairman Bernanke, the investment community was concerned the days of the Fed riding to the rescue when risky investments began to sour may be over. As discussed above, lower interest rates help fuel both monetary and price inflation. Therefore, the Fed's inflation-fighting credibility is at risk when the institution appears to mirror the Greenspan Fed. Anyone who has followed Bernanke's career was not surprised when the Fed recently sent a loud message indicating the Greenspan put is alive and well. In fact, we may see a turbo-charged Bernanke put in the form of faster and larger cuts. In a well-written article by Mike Swanson (wallstreetwindow.com), he states:
Bernanke built his career on a doctoral thesis that claimed the Fed didn't cut rates fast enough during the 1929 stock market crash. What Bernanke believes is the Fed should have cut rates all at once during the start of the bear market instead of gradually over two years. He seems to be putting this belief to work right now. Lower Rates and the Relative Performance of InvestmentsTo recap the main points above:
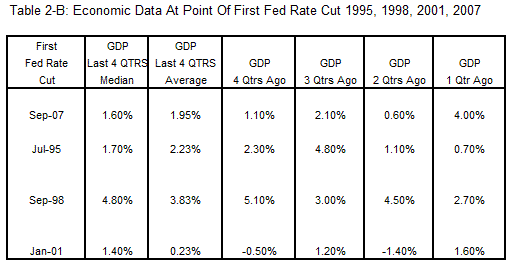
The Housing Market is Dragging Down the Economy - Time to Get Defensive, Right?While there are many valid reasons to be concerned about the outlook for housing, asset markets, and the U.S. economy, we have to balance our concerns with the possible Fed reaction to any further weakness, which would most likely be additional interest rate cuts. You may think this is a good time to be ultra conservative as an investor, but history and the Fed's track record are cause for striking a proper risk-reward balance based on what really matters in the long run, which is the preservation of purchasing power.The assets to avoid or underweight in an inflationary environment are the more conservative fixed investment options such as money markets, CDs, and bonds (debt). When you hold a fixed investment, you really do not own anything tangible; you have simply made a loan to another party which agrees to repay you, usually at a fixed rate. In a simple example, if annual price inflation is running at 10% per year, which was not uncommon in the 1970s, and you are earning 5% in CDs, your purchasing power is actually declining by 5% per year. It is unfortunate, but the current state of the economic landscape and monetary policy penalizes both prudent savers and conservative investors via the destruction of their hard-earned purchasing power. Endless credit creation forces all investors to take on more risk if they hope to outrun the Fed's money printers. A Prudent, Diversified, and Balanced Approach is NeededMy last update, Stock Market Behavior Following Fed Rate Cuts, examined three previous Fed rate-reduction cycles which occurred in similar economic environments to the one we have today. The results may have concerned some clients and loyal readers since it appeared to have a bullish bias. I am in no way considering or advocating any investor become overly aggressive with their allocation to stocks (especially U.S. stocks) given the current set of economic uncertainties. The analysis was done to simply gain some insight into the risk appetite of investors in the year following the first rate cut in a new Fed cycle. The results mesh well with my comments above in that investors did invest in stocks (a risk asset) following the first cut, at least in part to hedge against inflation. A significant part of successful investing is understanding how others most likely will react to current and expected market conditions. The cold, hard facts are the market does not care what we think as individuals. We can benefit from understanding how others will most likely react to the current set of circumstances given how they have reacted to similar circumstances in the past.Since there are an infinite number of variables which affect the relative performance of various investments, it is helpful to attempt to quantify the relative importance of some of the major variables such as inflation, the strength of the U.S. dollar vs. other currencies, GDP, unemployment, housing, interest rates (Fed Funds), and recent stock market performance. Our last update made a case the rate cutting cycles which began in July 1986, July 1995, September 1998, and January 2001, represented the best historical comparisons to the present day. In this update, I'll expand on the concept of similarity to past events and include the performance of multiple asset classes vs. just exploring the performance of the S&P 500 after the first rate cut. Since I have previously collected daily historical data for multiple assets classes going back to January 1, 1995, I eliminated the rate cutting cycle which began in July 1986. Determining How to Weight Different Factors and Different Historical PeriodsWith respect and understanding of the much warranted fear of further deterioration in the value of the U.S. dollar (a crash is called for by some), I decided to explore the relative importance of the U.S. dollar to stock prices vs. other major economic factors. The correlation between various economic factors and stock prices during the period 1995-2006 is shown in Table 1. The respective correlation to stock prices is relevant since stocks influence the risk appetite for all asset classes. The relative importance shown in the last column of Table 1 simply takes the absolute value of each correlation and scales them all to 100%.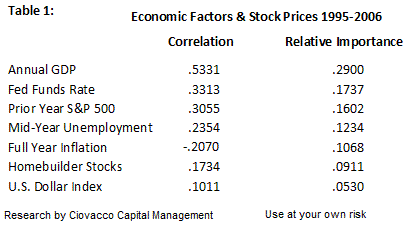

Expanding the Analysis to Other Asset ClassesWe can use the information above as one of many factors when determining our asset allocation for the coming year. The next logical step is to explore how different asset classes performed relative to each other in each of the three respective historical periods (1995-1996, 1998-1999, 2001-2002). I used the historical performance of each asset class to construct asset allocations which would have been prudent for each particular period. The resulting three asset allocations can then be combined into one allocation using the similarity weights found in Table 3, column 2. If there is a 16.54% probability the next year may look like 2001-2002, it makes sense to consider weighting 16.54% of your assets to an asset allocation which performed well under those economic conditions. The same is true for the other two historical periods. I have made these allocation calculations down to the last penny, but the detail is not necessary to convey the results. The specific results are not as important as the relative results, such as gold stocks performed better than long-maturity U.S. Treasury bonds in the year following the first Fed rate cut. Graph 1 illustrates the similarity-weighed historical path of each asset class one year after the first rate cut by combining weighted daily historical data from each of the three periods.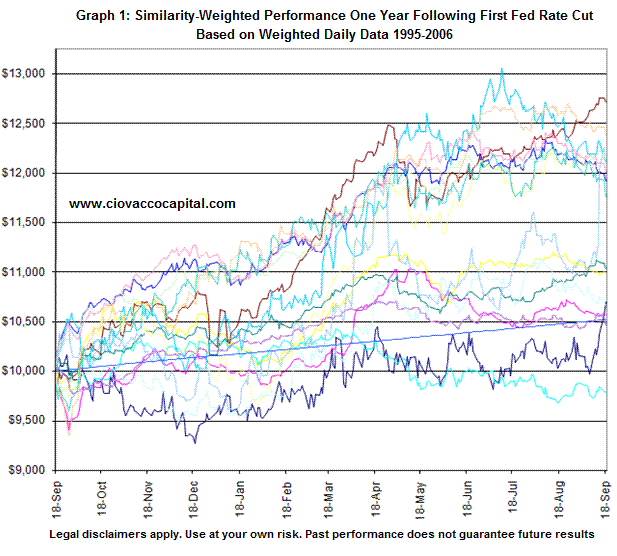 
What does it all mean?In a nutshell, as I review each client account, I will consider, within the context of the client's individual needs and risk-reward profile, reducing the exposure to the items in red and possibly increasing the exposure to the items in green. The good news is most accounts are allocated quite well already since we have been making small incremental changes over time. Clients who are relatively young or those who have a higher risk tolerance can place more weight toward the assets in green. Clients who have a lower risk tolerance can maintain a more balanced allocation. We will continue to run a diversified strategy. The objective is not to eliminate the items in red or to only invest in the items in green, but to use the results as a guide to make some "tweaks" to our asset allocation. For example, some accounts may reduce their exposure to U.S. commercial real estate, U.S. long bonds (long-dated maturity U.S. Treasuries), and/or U.S. intermediate bonds. The proceeds could be reinvested into more attractive options, such as gold mining stocks, timber, or any asset class in green above. There is no need to make radical changes to any account since we have been expecting some economic challenges based on a peaking housing market. My plan is to review all accounts the week of the 09.30.07 in search of ways to possibly improve the balance between protecting against the loss of principal and protecting against the loss of purchasing power. To emphasize the importance of maintaining that balance, I have included the annual inflation rates from 1971 through 1981 in Table 5. I doubt many of you have assumed in any financial projection we could experience an 11-year period where the average annual inflation rate is 8.19%. Notice inflation was somewhat tame, as the published figures show today, in 1971 and 1972. Annual inflation rates more than doubled in 1973 going on to average 9.26% annually between 1973 and 1981.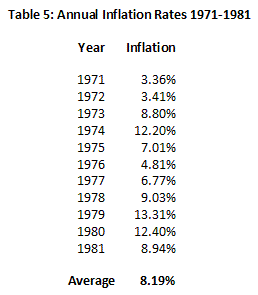 I will continue to act in your best interests. I am confident that we are very well positioned for the coming year and beyond. As always, I greatly appreciate your trust, support, and loyalty.
Chris Ciovacco
All material presented herein is believed to be reliable but we cannot attest to its accuracy. Investment recommendations may change and readers are urged to check with their investment counselors and tax advisors before making any investment decisions. Opinions expressed in these reports may change without prior notice. This memorandum is based on information available to the public. No representation is made that it is accurate or complete. This memorandum is not an offer to buy or sell or a solicitation of an offer to buy or sell the securities mentioned. The investments discussed or recommended in this report may be unsuitable for investors depending on their specific investment objectives and financial position. Past performance is not necessarily a guide to future performance. The price or value of the investments to which this report relates, either directly or indirectly, may fall or rise against the interest of investors. All prices and yields contained in this report are subject to change without notice. |